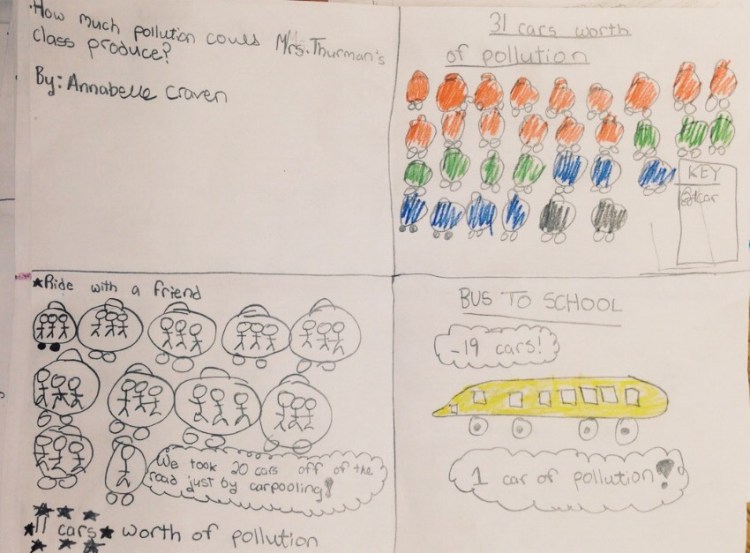
During our study of air pollution, we came across some math problems that would truly help us understand the effects of our choices. While discussing the differences in choosing to take your own car, carpooling, or taking a bus, it was hard for the students to grasp on a larger scale. We decided to use the example of just their class and use some informal dividing techniques to determine how many “cars worth” of pollution could be taken off the road depending on the choices they made.
This particular class had 31 students so they determined that if they each took their own cars to school that would be 31 “cars worth” of pollution. Then they decided that they could fit at least two other students in each car so if they divided those 31 students into groups of 3 they would only need to take 11 cars to school – that already took 20 cars off the road! Then, if they took a bus they could not only fit their entire class but probably another entire class too – that’s only 1 “car worth” of pollution.
Even though our units of measurement are not entirely scientific this project was a great visual of the impact these small choices can make (while reviewing both division and subtraction).
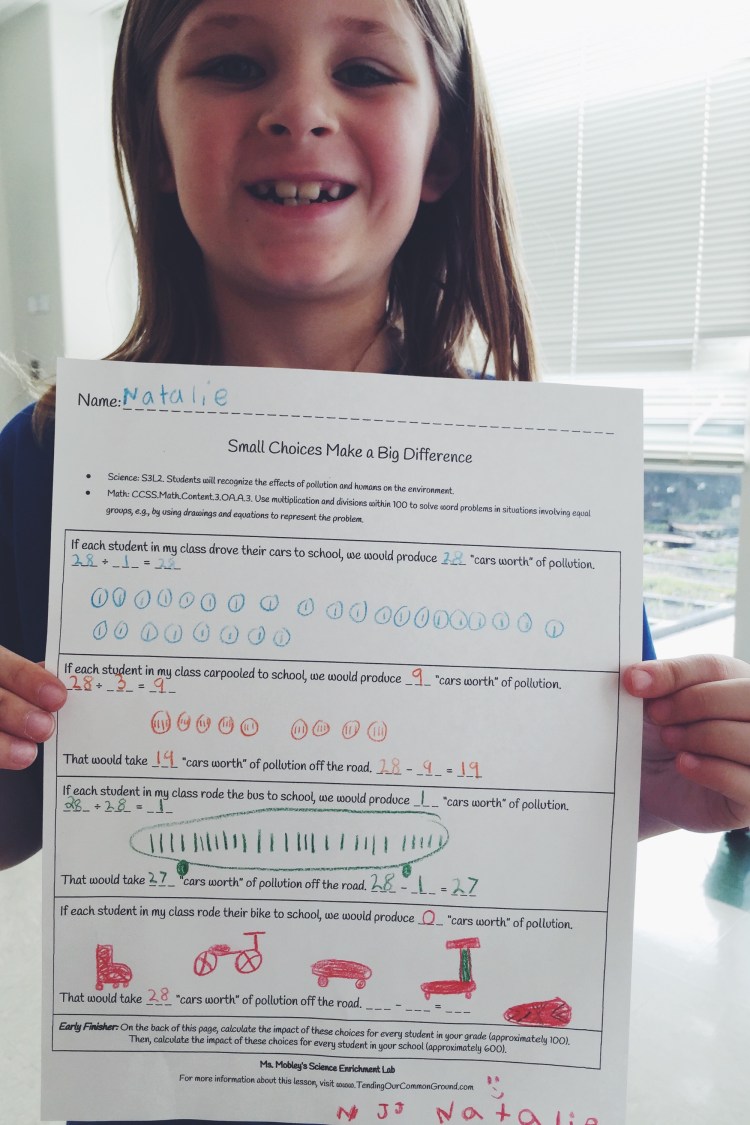
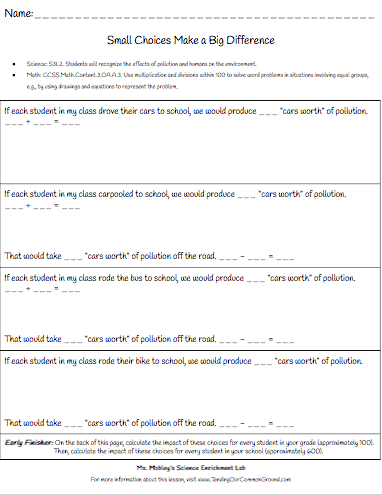
Here is a worksheet designed to guide this discussion:
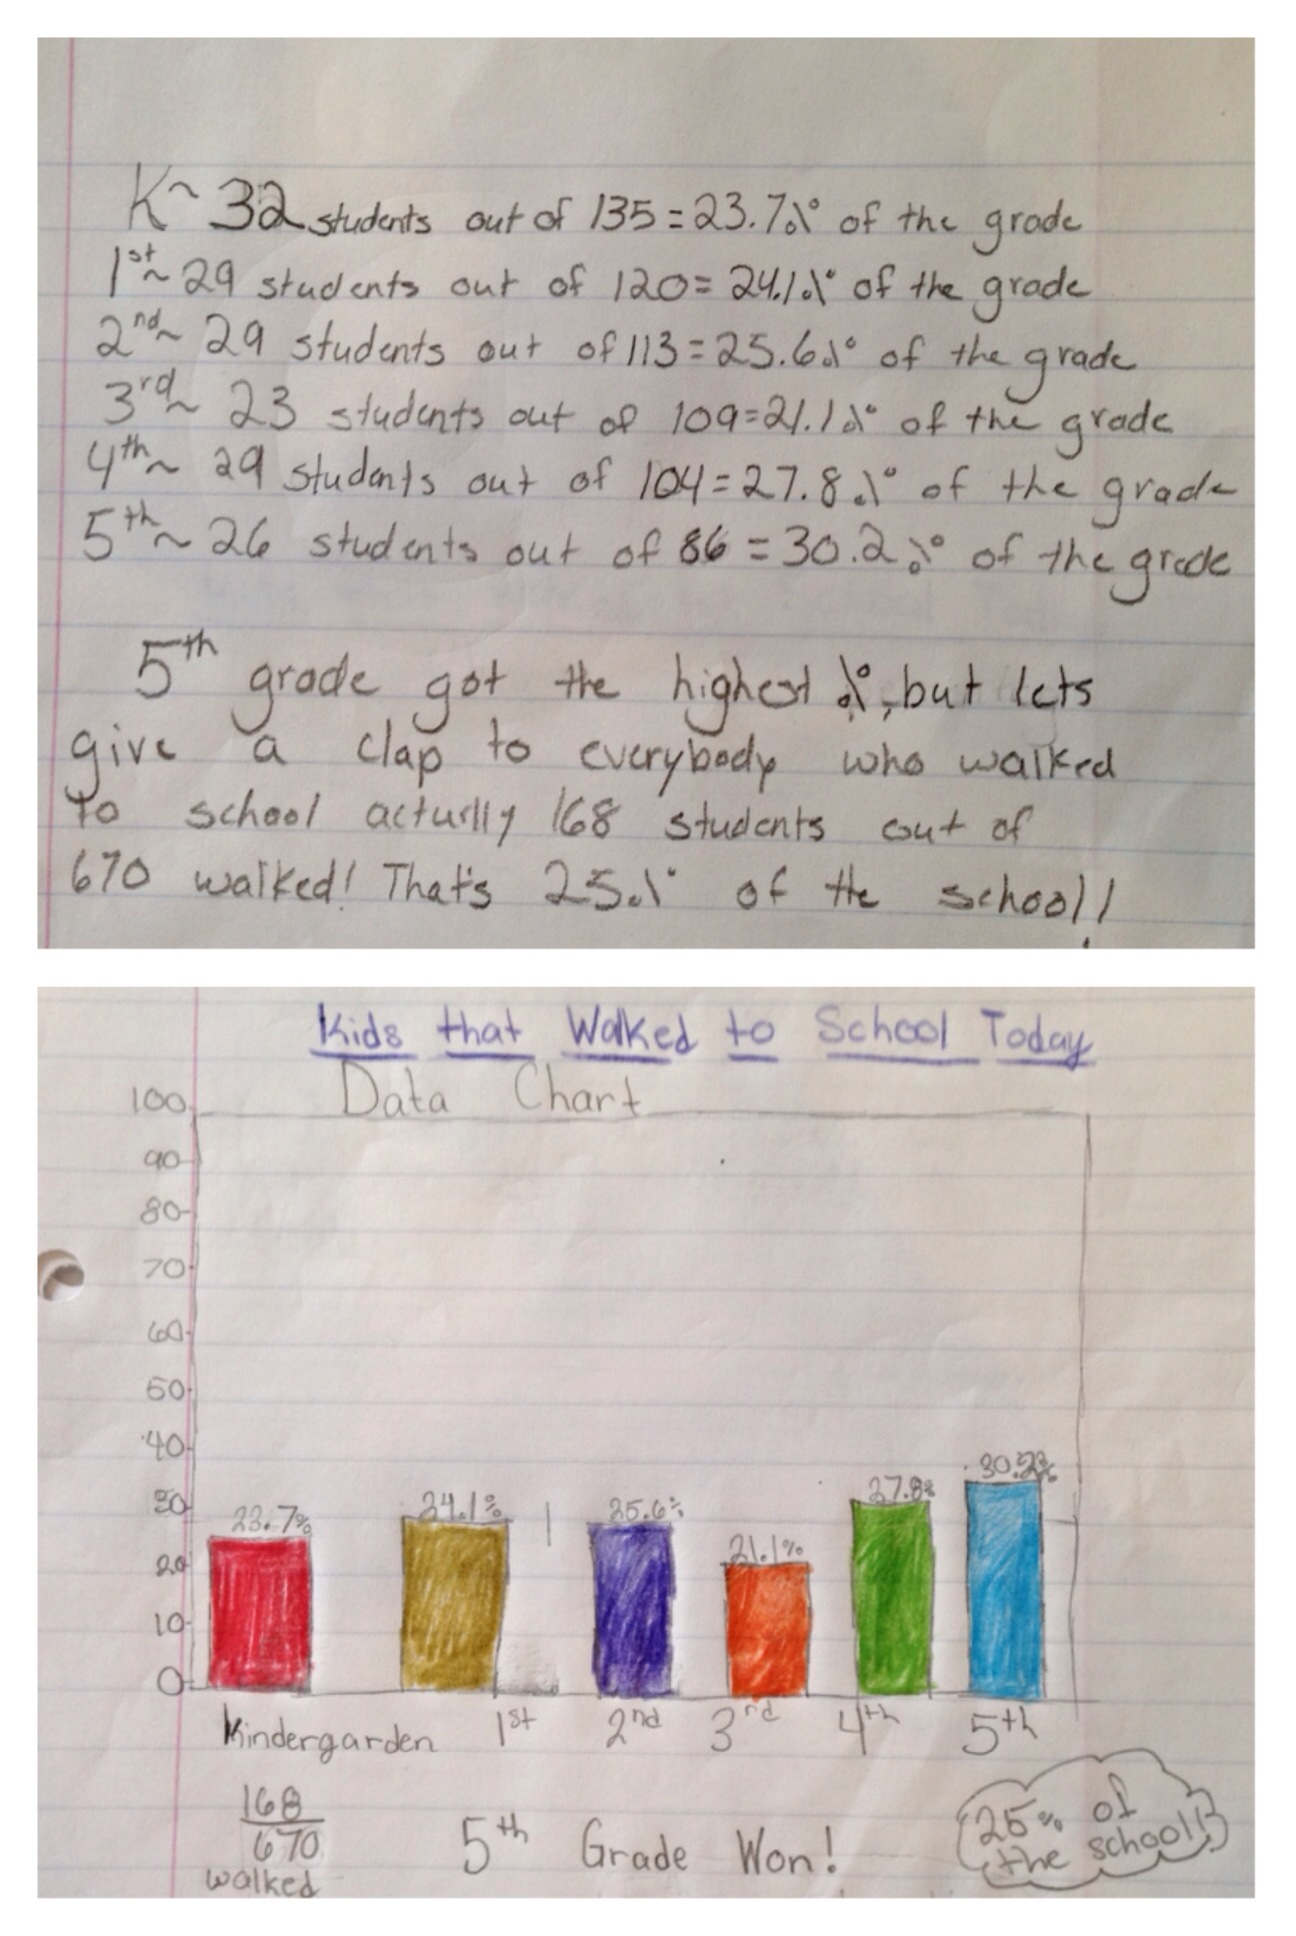
After Walk to School Day, we always collect data on participation. For K-1st, we collect data for their class in either a tally chart, a pictograph, or a bar graph. For 2nd-3rd grades, we try to collect data from their entire grade. 4th-5th students collect data for the entire school. Once the data is collected they spend most of the class period analyzing the data. Comparing participation across classes or grades (and for advanced students from across the past years of having the event) and talking about the affects of the good choices students made.